#Dimensional Datasets
Explore tagged Tumblr posts
Visit Tumblr Blog
Explore Tumblr blogs with no restrictions, modern design and the best experience.
Last Seen Tumblr Blogs


Fun Fact
Tumblr was attacked by a cross-site scripting worm deployed by the Internet troll group GNAA on Dec 3, 2012.
Text
Seeing a lot of python hate on the dash today... fight me guys. I love python. I am a smoothbrained python enjoyer and I will not apologize for it
Python has multiple noteworthy virtues, but the most important one is that you can accomplish stuff extremely fast in it if you know what you are doing.
This property is invaluable when you're doing anything that resembles science, because
Most of the things you do are just not gonna work out, and you don't want to waste any time "designing" them "correctly." You can always go back later and give that kind of treatment to the rare idea that actually deserves it.
Many of your problems will be downstream from the limitations in how well you can "see" things (high-dimensional datasets, etc.) that humans aren't naturally equipped to engage with. You will be asking lots and lots of weirdly shaped, one-off questions, all the time, and the faster they get answered the better. Ideally you should be able to get into a flow state where you barely remember that you're technically "coding" on a "computer" -- you feel like you're just looking at something, from an angle of your choice, and then another.
You will not completely understand the domain/problem you're working on, at the outset. Any model you express of it, in code, will be a snapshot of a bad, incomplete mental model you'll eventually grow to hate, unless you're able to (cheaply) discard it and move on. These things should be fast to write, fast to modify, and not overburdened by doctrinaire formal baggage or a scale-insensitive need to chase down tiny performance gains. You can afford to wait 5 seconds occasionally if it'll save you hours or days every time your mental map of reality shifts.
The flipside of this is that it is also extremely (and infamously) easy to be a bad python programmer.
In python doing the obvious thing usually just works, which means you can get away with not knowing why it works and usually make it through OK. Yes, this is cringe or whatever, fine. But by the same token, if you do know what the right thing to do is, that thing is probably very concise and pretty-looking and transparent, because someone explicitly thought to design things that way. What helps (or enables) script kiddies can also be valuable to power users; it's not like there's some fundamental reason the interests of these two groups cannot ever align.
559 notes
·
View notes
Text
A new study titled "Biomimetic hepatic lobules from three-dimensional imprinted cell sheets" has been led by Prof. Yuanjin Zhao of the Department of Hepatobiliary Surgery, Hepatobiliary Institute, Nanjing Drum Tower Hospital, Medical School, of Nanjing University in China. The research is published in the journal Science Bulletin. To establish high-precision liver lobules, researchers utilized spatial proteogenomic datasets to identify the multicellular specific composition in the normal human liver. Based on this data and cell membrane slicing technology, researchers then employed a newly developed 3D printing strategy to print and carve liver cell sheets with hexagonal hollow cross-sectional structures.
Continue Reading.
82 notes
·
View notes
Text
A Mayan city lost in the dense jungle of southern Mexico has been revealed. The discovery occurred in the southeastern state of Campeche, and archaeologists have named it Valeriana, after a nearby freshwater lagoon.
“The larger of Valeriana's two monumental precincts has all the hallmarks of a classic Mayan political capital: enclosed plazas connected by a broad causeway; temple pyramids; a ball court; a reservoir formed by damming an arroyo (a seasonal watercourse); and a probable E-Group assemblage, an architectural arrangement that generally indicates a founding date prior to AD 150,” says the study, published in the journal Antiquity.
The city's discovery didn't require breaking through the jungle with machetes or patiently excavating with brushes and spatulas. Nor did researchers need tape measures, binoculars, or compasses to find their way through the thick foliage. Instead, they employed state-of-the-art technology: lasers, drones, and satellite maps. With these tools, they discovered a city hidden for centuries beneath the thick Mexican jungle, unearthing pyramids, enclosed plazas, and an ancient reservoir.
Luke Auld-Thomas, an anthropologist at Northern Arizona University, made the discovery. His analysis revealed a huge network of previously unexplored settlements.
Auld-Thomas and his fellow researchers have succeeded in mapping the city beneath the jungle thanks to airborne laser scanning, better known as lidar (light detection and ranging), a remote-sensing technique that uses pulsed lasers and other data collected through flyovers that can generate accurate three-dimensional models of surface features, revolutionizing the way archaeologists explore the hidden past.
Laser pulses generate a topographic map in a manner similar to how a bat uses echolocation: Laser light is fired from an aircraft, bounces off objects on the ground, and returns to the detector located on the underside of the aircraft. In Mexico, although only a small fraction of the pulses pass through the dense jungle, the large number of pulses emitted allows enough light to reach the ground, creating a map with a resolution of up to 1 meter. Based on the timing and intensity of the returning pulses, the detector can map the contours of the terrain, revealing hills, ditches, and ancient ruins covered in vegetation. The technology is also being integrated into autonomous cars to help them avoid crashes.
“For a long time, our understanding of the Mayan civilization was limited to an area of a few hundred square kilometers,” Auld-Thomas says. “This limited sample was obtained with great effort, with archaeologists painstakingly scouring every square meter, hacking away at vegetation with machetes, only to discover they were standing on a pile of rocks that might have been someone's house 1,500 years ago.”
While Auld-Thomas knew that lidar could be a valuable tool, he was also aware of its high cost. Funders are often reluctant to invest in lidar surveys in areas where there is no visible evidence of Mayan settlement, despite the fact that this civilization reached its peak between 250 and 900 AD.
Campeche: A Center of Dense Urbanization Since the Mayan Era
In this case, the lidar data was originally collected over a decade ago, for completely unrelated purposes. The scans were completely in 2013 by the Mexican firm CartoData, using a Riegl LMS-Q780 sensor. Processing was carried out by the Woods Hole Research Center (WHRC), and the data was made publicly available a few years later by the M-REDD+ Alliance.
The dataset includes three transects and three study blocks. The transects have an approximate width of 275 meters and a total length of 213 kilometers, covering an area of 58.3 square kilometers. The survey blocks cover a total area of 64.1 square kilometers, distributed in three locations: south of the town of Xpuhil, near the archaeological site of Río Bec; near the villages of Dos Lagunas and Bel Ha; and near the town of Ucum, in northern Campeche.
The study mentions that the analysis of 6,764 structures in the lidar data blocks reveals a settlement density of 55.3 structures per square kilometer, comparable to other research in the region. These data are useful for assessing settlement density on a regional scale and exceed values recorded in Belize and Guatemala. However, they do not provide a complete picture of the level of urbanization, which requires analysis of local variability and density gradients. For this purpose, a kernel density estimation was applied to the study blocks, the results of which are consistent with the densities recorded in other Mayan archeological sites such as Oxpemul and Becan.
Archeologists in the 20th century were correct in stating that the interior of Campeche is a substantially anthropogenic landscape, i.e., human-modified, with urbanized areas where rural populations interacted with dense cities. Settlement density data, ranging from 49 to 61 structures per square kilometer, indicate that cities and dense settlements are common in large parts of the central Maya lowlands. New discoveries, such as the city of Valeriana, reinforce this view, showing that urbanization was a widespread phenomenon in the region.
Archaeologists increasingly recognize that the world's tropics and subtropics hosted a wide variety of urban forms in antiquity. Many of these settlements followed a pattern of spatial dispersion, commonly called “low-density urbanism.” However, it is now being recognized that these urban landscapes were not uniform, but exhibited significant variations in settlement density, both within and around cities and between subregions.
At the same time, the growing body of research has revealed a greater abundance of settlements and cities than had previously been contemplated. This has generated a tension between two developments: On the one hand, the recognition of high variability in settlement density and, on the other, evidence of a more densely urbanized past than previously thought.
Although lidar was developed in the 1960s to study clouds and atmospheric particles, its application in archaeology is relatively recent. It was not until the last decade that archaeologists began employing it to unearth hidden landscapes. In 2009, archaeologists Diane and Arlen Chase of the University of Nevada, Las Vegas, pioneered the use of lidar to map a Mayan city, revolutionizing the way ancient civilizations are detected and studied.
According to the study, some researchers argue that the discovered landscapes reflect a high population density, while others suggest that the surveys are biased and overrepresent the most densely populated areas. This leaves open the question of whether as yet unexplored areas could confirm the existence of a higher urban density or show less dense occupation.
22 notes
·
View notes
Text

AI model improves 4D STEM imaging for delicate materials
Researchers at Monash University have developed an artificial intelligence (AI) model that significantly improves the accuracy of four-dimensional scanning transmission electron microscopy (4D STEM) images. Called unsupervised deep denoising, this model could be a game-changer for studying materials that are easily damaged during imaging, like those used in batteries and solar cells. The research from Monash University's School of Physics and Astronomy, and the Monash Center of Electron Microscopy, presents a novel machine learning method for denoising large electron microscopy datasets. The study was published in npj Computational Materials. 4D STEM is a powerful tool that allows scientists to observe the atomic structure of materials in unprecedented detail.
Read more.
#Materials Science#Science#Materials Characterization#Computational materials science#Electron microscopy#Monash University
20 notes
·
View notes
Text

A less ‘clumpy,’ more complex universe?
Researchers combined cosmological data from two major surveys of the universe’s evolutionary history and found that it may have become ‘messier and complicated’ than expected in recent years.
Across cosmic history, powerful forces have acted on matter, reshaping the universe into an increasingly complex web of structures.
Now, new research led by Joshua Kim and Mathew Madhavacheril at the University of Pennsylvania and their collaborators at Lawrence Berkeley National Laboratory suggests our universe has become “messier and more complicated” over the roughly 13.8 billion years it’s been around, or rather, the distribution of matter over the years is less “clumpy” than expected.
“Our work cross-correlated two types of datasets from complementary, but very distinct, surveys,” says Madhavacheril, “and what we found was that for the most part, the story of structure formation is remarkably consistent with the predictions from Einstein’s gravity. We did see a hint for a small discrepancy in the amount of expected clumpiness in recent epochs, around four billion years ago, which could be interesting to pursue.”
The data, published in the Journal of Cosmology and Astroparticle Physics and the preprint server arXiv, comes from the Atacama Cosmology Telescope’s (ACT) final data release (DR6) and the Dark Energy Spectroscopic Instrument’s (DESI) Year 1. Madhavacheril says that pairing this data allowed the team to layer cosmic time in a way that resembles stacking transparencies of ancient cosmic photographs over recent ones, giving a multidimensional perspective of the cosmos.
“ACT, covering approximately 23% of the sky, paints a picture of the universe’s infancy by using a distant, faint light that’s been travelling since the Big Bang,” says first author of the paper Joshua Kim, a graduate researcher in the Madhavacheril Group. “Formally, this light is called the Cosmic Microwave Background (CMB), but we sometimes just call it the universe’s baby picture because it’s a snapshot of when it was around 380,000 years old.”
The path of this ancient light throughout evolutionary time, or as the universe has aged, has not been a straight one, Kim explains. Gravitational forces from large, dense, heavy structures like galaxy clusters in the cosmos have been warping the CMB, sort of like how an image is distorted as it travels through a pair of spectacles. This “gravitational lensing effect,” which was first predicted by Einstein more than 100 years ago, is how cosmologists make inferences about its properties like matter distribution and age.
DESI’s data, on the other hand, provides a more recent record of the cosmos. Based in the Kitt Peak National Observatory in Arizona and operated by the Lawrence Berkeley National Laboratory, DESI is mapping the universe’s three-dimensional structure by studying the distribution of millions of galaxies, particularly luminous red galaxies (LRGs). These galaxies act as cosmic landmarks, making it possible for scientists to trace how matter has spread out over billions of years.
“The LRGs from DESI are like a more recent picture of the universe, showing us how galaxies are distributed at varying distances,” Kim says, likening the data to the universe’s high school yearbook photo. “It’s a powerful way to see how structures have evolved from the CMB map to where galaxies stand today.
By combining the lensing maps from ACT’s CMB data with DESI’s LRGs, the team created an unprecedented overlap between ancient and recent cosmic history, enabling them to compare early- and late-universe measurements directly. “This process is like a cosmic CT scan,” says Madhavacheril, “where we can look through different slices of cosmic history and track how matter clumped together at different epochs. It gives us a direct look into how the gravitational influence of matter changed over billions of years.”
In doing so they noticed a small discrepancy: the clumpiness, or density fluctuations, expected at later epochs didn’t quite match predictions. Sigma 8 (σ8), a metric that measures the amplitude of matter density fluctuations, is a key factor, Kim says, and lower values of σ8 indicate less clumping than expected, which could mean that cosmic structures haven’t evolved according to the predictions from early-universe models and suggest that the universe’s structural growth may have slowed in ways current models don’t fully explain.
This slight disagreement with expectations, he explains, “isn’t strong enough to suggest new physics conclusively—it’s still possible that this deviation is purely by chance.”
If indeed the deviation is not by chance, some unaccounted-for physics could be at play, moderating how structures form and evolve over cosmic time. One hypothesis is that dark energy—the mysterious force thought to drive the universe’s accelerating expansion—could be influencing cosmic structure formation more than previously understood.
Moving forward, the team will work with more powerful telescopes, like the upcoming Simons Observatory, which will refine these measurements with higher precision, enabling a clearer view of cosmic structures.
IMAGE: The Atacama Cosmology Telescope measures the oldest light in the universe, known as the cosmic microwave background. Using those measurements, scientists can calculate the universe’s age. (Image: Debra Kellner)
5 notes
·
View notes
Text
Python Libraries to Learn Before Tackling Data Analysis
To tackle data analysis effectively in Python, it's crucial to become familiar with several libraries that streamline the process of data manipulation, exploration, and visualization. Here's a breakdown of the essential libraries:
1. NumPy
- Purpose: Numerical computing.
- Why Learn It: NumPy provides support for large multi-dimensional arrays and matrices, along with a collection of mathematical functions to operate on these arrays efficiently.
- Key Features:
- Fast array processing.
- Mathematical operations on arrays (e.g., sum, mean, standard deviation).
- Linear algebra operations.
2. Pandas
- Purpose: Data manipulation and analysis.
- Why Learn It: Pandas offers data structures like DataFrames, making it easier to handle and analyze structured data.
- Key Features:
- Reading/writing data from CSV, Excel, SQL databases, and more.
- Handling missing data.
- Powerful group-by operations.
- Data filtering and transformation.
3. Matplotlib
- Purpose: Data visualization.
�� - Why Learn It: Matplotlib is one of the most widely used plotting libraries in Python, allowing for a wide range of static, animated, and interactive plots.
- Key Features:
- Line plots, bar charts, histograms, scatter plots.
- Customizable charts (labels, colors, legends).
- Integration with Pandas for quick plotting.
4. Seaborn
- Purpose: Statistical data visualization.
- Why Learn It: Built on top of Matplotlib, Seaborn simplifies the creation of attractive and informative statistical graphics.
- Key Features:
- High-level interface for drawing attractive statistical graphics.
- Easier to use for complex visualizations like heatmaps, pair plots, etc.
- Visualizations based on categorical data.
5. SciPy
- Purpose: Scientific and technical computing.
- Why Learn It: SciPy builds on NumPy and provides additional functionality for complex mathematical operations and scientific computing.
- Key Features:
- Optimized algorithms for numerical integration, optimization, and more.
- Statistics, signal processing, and linear algebra modules.
6. Scikit-learn
- Purpose: Machine learning and statistical modeling.
- Why Learn It: Scikit-learn provides simple and efficient tools for data mining, analysis, and machine learning.
- Key Features:
- Classification, regression, and clustering algorithms.
- Dimensionality reduction, model selection, and preprocessing utilities.
7. Statsmodels
- Purpose: Statistical analysis.
- Why Learn It: Statsmodels allows users to explore data, estimate statistical models, and perform tests.
- Key Features:
- Linear regression, logistic regression, time series analysis.
- Statistical tests and models for descriptive statistics.
8. Plotly
- Purpose: Interactive data visualization.
- Why Learn It: Plotly allows for the creation of interactive and web-based visualizations, making it ideal for dashboards and presentations.
- Key Features:
- Interactive plots like scatter, line, bar, and 3D plots.
- Easy integration with web frameworks.
- Dashboards and web applications with Dash.
9. TensorFlow/PyTorch (Optional)
- Purpose: Machine learning and deep learning.
- Why Learn It: If your data analysis involves machine learning, these libraries will help in building, training, and deploying deep learning models.
- Key Features:
- Tensor processing and automatic differentiation.
- Building neural networks.
10. Dask (Optional)
- Purpose: Parallel computing for data analysis.
- Why Learn It: Dask enables scalable data manipulation by parallelizing Pandas operations, making it ideal for big datasets.
- Key Features:
- Works with NumPy, Pandas, and Scikit-learn.
- Handles large data and parallel computations easily.
Focusing on NumPy, Pandas, Matplotlib, and Seaborn will set a strong foundation for basic data analysis.
8 notes
·
View notes
Text

A Beginner's Guide to Principal Component Analysis (PCA) in Data Science and Machine Learning
Principal Component Analysis (PCA) is one of the most important techniques for dimensionality reduction in machine learning and data science. It allows us to simplify datasets, making them easier to work with while retaining as much valuable information as possible. PCA has become a go-to method for preprocessing high-dimensional data.
Click here to read more
#artificial intelligence#bigdata#books#machine learning#machinelearning#programming#python#science#skills#big data
3 notes
·
View notes
Text
From Curious Novice to Data Enthusiast: My Data Science Adventure
I've always been fascinated by data science, a field that seamlessly blends technology, mathematics, and curiosity. In this article, I want to take you on a journey—my journey—from being a curious novice to becoming a passionate data enthusiast. Together, let's explore the thrilling world of data science, and I'll share the steps I took to immerse myself in this captivating realm of knowledge.

The Spark: Discovering the Potential of Data Science
The moment I stumbled upon data science, I felt a spark of inspiration. Witnessing its impact across various industries, from healthcare and finance to marketing and entertainment, I couldn't help but be drawn to this innovative field. The ability to extract critical insights from vast amounts of data and uncover meaningful patterns fascinated me, prompting me to dive deeper into the world of data science.
Laying the Foundation: The Importance of Learning the Basics
To embark on this data science adventure, I quickly realized the importance of building a strong foundation. Learning the basics of statistics, programming, and mathematics became my priority. Understanding statistical concepts and techniques enabled me to make sense of data distributions, correlations, and significance levels. Programming languages like Python and R became essential tools for data manipulation, analysis, and visualization, while a solid grasp of mathematical principles empowered me to create and evaluate predictive models.
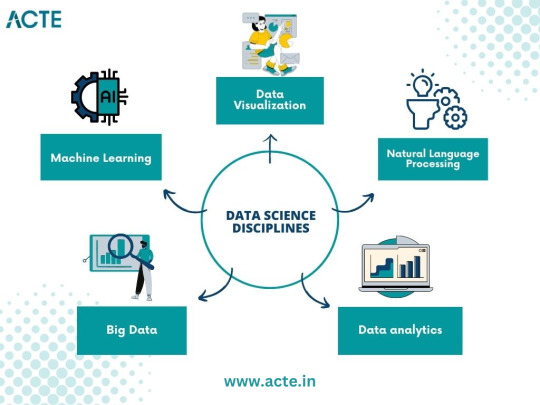
The Quest for Knowledge: Exploring Various Data Science Disciplines
A. Machine Learning: Unraveling the Power of Predictive Models
Machine learning, a prominent discipline within data science, captivated me with its ability to unlock the potential of predictive models. I delved into the fundamentals, understanding the underlying algorithms that power these models. Supervised learning, where data with labels is used to train prediction models, and unsupervised learning, which uncovers hidden patterns within unlabeled data, intrigued me. Exploring concepts like regression, classification, clustering, and dimensionality reduction deepened my understanding of this powerful field.
B. Data Visualization: Telling Stories with Data
In my data science journey, I discovered the importance of effectively visualizing data to convey meaningful stories. Navigating through various visualization tools and techniques, such as creating dynamic charts, interactive dashboards, and compelling infographics, allowed me to unlock the hidden narratives within datasets. Visualizations became a medium to communicate complex ideas succinctly, enabling stakeholders to understand insights effortlessly.
C. Big Data: Mastering the Analysis of Vast Amounts of Information
The advent of big data challenged traditional data analysis approaches. To conquer this challenge, I dived into the world of big data, understanding its nuances and exploring techniques for efficient analysis. Uncovering the intricacies of distributed systems, parallel processing, and data storage frameworks empowered me to handle massive volumes of information effectively. With tools like Apache Hadoop and Spark, I was able to mine valuable insights from colossal datasets.
D. Natural Language Processing: Extracting Insights from Textual Data
Textual data surrounds us in the digital age, and the realm of natural language processing fascinated me. I delved into techniques for processing and analyzing unstructured text data, uncovering insights from tweets, customer reviews, news articles, and more. Understanding concepts like sentiment analysis, topic modeling, and named entity recognition allowed me to extract valuable information from written text, revolutionizing industries like sentiment analysis, customer service, and content recommendation systems.
Building the Arsenal: Acquiring Data Science Skills and Tools
Acquiring essential skills and familiarizing myself with relevant tools played a crucial role in my data science journey. Programming languages like Python and R became my companions, enabling me to manipulate, analyze, and model data efficiently. Additionally, I explored popular data science libraries and frameworks such as TensorFlow, Scikit-learn, Pandas, and NumPy, which expedited the development and deployment of machine learning models. The arsenal of skills and tools I accumulated became my assets in the quest for data-driven insights.
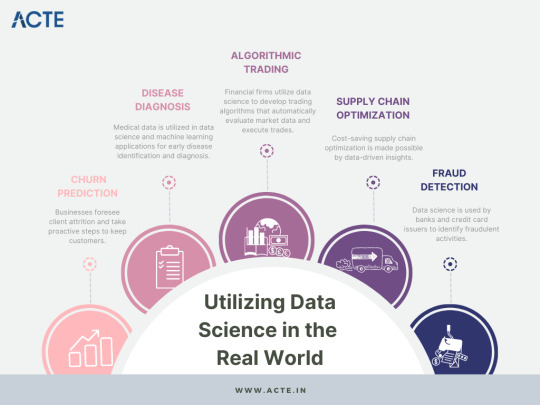
The Real-World Challenge: Applying Data Science in Practice
Data science is not just an academic pursuit but rather a practical discipline aimed at solving real-world problems. Throughout my journey, I sought to identify such problems and apply data science methodologies to provide practical solutions. From predicting customer churn to optimizing supply chain logistics, the application of data science proved transformative in various domains. Sharing success stories of leveraging data science in practice inspires others to realize the power of this field.
Cultivating Curiosity: Continuous Learning and Skill Enhancement
Embracing a growth mindset is paramount in the world of data science. The field is rapidly evolving, with new algorithms, techniques, and tools emerging frequently. To stay ahead, it is essential to cultivate curiosity and foster a continuous learning mindset. Keeping abreast of the latest research papers, attending data science conferences, and engaging in data science courses nurtures personal and professional growth. The journey to becoming a data enthusiast is a lifelong pursuit.
Joining the Community: Networking and Collaboration
Being part of the data science community is a catalyst for growth and inspiration. Engaging with like-minded individuals, sharing knowledge, and collaborating on projects enhances the learning experience. Joining online forums, participating in Kaggle competitions, and attending meetups provides opportunities to exchange ideas, solve challenges collectively, and foster invaluable connections within the data science community.
Overcoming Obstacles: Dealing with Common Data Science Challenges
Data science, like any discipline, presents its own set of challenges. From data cleaning and preprocessing to model selection and evaluation, obstacles arise at each stage of the data science pipeline. Strategies and tips to overcome these challenges, such as building reliable pipelines, conducting robust experiments, and leveraging cross-validation techniques, are indispensable in maintaining motivation and achieving success in the data science journey.
Balancing Act: Building a Career in Data Science alongside Other Commitments
For many aspiring data scientists, the pursuit of knowledge and skills must coexist with other commitments, such as full-time jobs and personal responsibilities. Effectively managing time and developing a structured learning plan is crucial in striking a balance. Tips such as identifying pockets of dedicated learning time, breaking down complex concepts into manageable chunks, and seeking mentorships or online communities can empower individuals to navigate the data science journey while juggling other responsibilities.
Ethical Considerations: Navigating the World of Data Responsibly
As data scientists, we must navigate the world of data responsibly, being mindful of the ethical considerations inherent in this field. Safeguarding privacy, addressing bias in algorithms, and ensuring transparency in data-driven decision-making are critical principles. Exploring topics such as algorithmic fairness, data anonymization techniques, and the societal impact of data science encourages responsible and ethical practices in a rapidly evolving digital landscape.
Embarking on a data science adventure from a curious novice to a passionate data enthusiast is an exhilarating and rewarding journey. By laying a foundation of knowledge, exploring various data science disciplines, acquiring essential skills and tools, and engaging in continuous learning, one can conquer challenges, build a successful career, and have a good influence on the data science community. It's a journey that never truly ends, as data continues to evolve and offer exciting opportunities for discovery and innovation. So, join me in your data science adventure, and let the exploration begin!
#data science#data analytics#data visualization#big data#machine learning#artificial intelligence#education#information
17 notes
·
View notes
Text
Can I use Python for big data analysis?
Yes, Python is a powerful tool for big data analysis. Here’s how Python handles large-scale data analysis:

Libraries for Big Data:
Pandas:
While primarily designed for smaller datasets, Pandas can handle larger datasets efficiently when used with tools like Dask or by optimizing memory usage..
NumPy:
Provides support for large, multi-dimensional arrays and matrices, along with a collection of mathematical functions to operate on these arrays.
Dask:
A parallel computing library that extends Pandas and NumPy to larger datasets. It allows you to scale Python code from a single machine to a distributed cluster
Distributed Computing:
PySpark:
The Python API for Apache Spark, which is designed for large-scale data processing. PySpark can handle big data by distributing tasks across a cluster of machines, making it suitable for large datasets and complex computations.
Dask:
Also provides distributed computing capabilities, allowing you to perform parallel computations on large datasets across multiple cores or nodes.
Data Storage and Access:
HDF5:
A file format and set of tools for managing complex data. Python’s h5py library provides an interface to read and write HDF5 files, which are suitable for large datasets.
Databases:
Python can interface with various big data databases like Apache Cassandra, MongoDB, and SQL-based systems. Libraries such as SQLAlchemy facilitate connections to relational databases.
Data Visualization:
Matplotlib, Seaborn, and Plotly: These libraries allow you to create visualizations of large datasets, though for extremely large datasets, tools designed for distributed environments might be more appropriate.
Machine Learning:
Scikit-learn:
While not specifically designed for big data, Scikit-learn can be used with tools like Dask to handle larger datasets.
TensorFlow and PyTorch:
These frameworks support large-scale machine learning and can be integrated with big data processing tools for training and deploying models on large datasets.
Python’s ecosystem includes a variety of tools and libraries that make it well-suited for big data analysis, providing flexibility and scalability to handle large volumes of data.
Drop the message to learn more….!
2 notes
·
View notes
Text
Correspondence analysis is a statistical technique used to analyze the associations between categorical variables in large datasets. It aims to uncover patterns and relationships between the categories of different variables by visualizing them in a low-dimensional space, typically a two-dimensional plot.
This method is particularly useful when dealing with categorical data, such as survey responses, where variables are not numerical but represent different categories or levels. Correspondence analysis transforms the categorical data into a graphical representation, allowing for easier interpretation of relationships between variables.
#market research#correspondance analysis in marketing research#market research analyst#market research companies in india#market research tools#data analysis in research
2 notes
·
View notes
Text
The Ever-Changing Length of the PCT
The most recent edition of the PCT's "Trail Dirt" tackled the mystery of the PCT length . . . it has been a topic that has been a curiosity also explored on this website -- https://pcttrailsidereader.com/post/618834872879939586/it-looks-authoritative-and-permanent-but-the The midpoint looks so official but as this article explains, the length of the trail is constantly changing . . . hence moving the midpoint. However, the marker stays put.
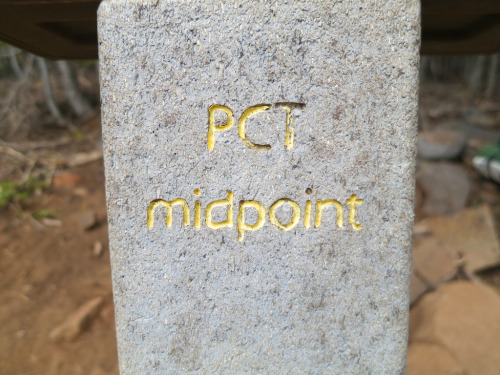
Easy, 2,650 Miles, right? Well… not quite.
By Galen Keily
The question of the PCT’s length comes up often, with guidebooks, phone apps, and other sources across the internet offering varying figures. In recent years, PCTA has come a long way in better tracking and calculating distance. While we regularly reference the rounded figure of 2,650 miles as shorthand for the trail’s length, our current best estimate places it at approximately 2655.8 miles. It’s complicated because the length actually varies year by year, and homing in on highly accurate mileage for a trail that spans thousands of miles can pose significant challenges. We know that trail mileage matters a lot to PCT trail users. Read on to discover some of the complexities involved in determining the true length of the PCT.

Northern Terminus, Photo by: Ryan Weidert
It Moves!
Sometimes, the trail gains a mile or two, or sometimes, the trail shaves off miles (you’re welcome thru-hikers!) You might be thinking… how does this happen, isn’t the trail already on the ground? While true, PCTA, alongside managing agencies and dedicated trail crews, continually refines and optimizes the trail’s route. These efforts range from minor adjustments to larger-scale relocation projects aimed at enhancing the overall trail experience. For instance, routine maintenance often involves realigning sections of the trail to improve sustainability, such as adding switchbacks or adjusting trail tread within the existing corridor. These alterations might end up making the trail a bit longer or shorter, typically on the order of hundreds of feet. Pretty small potatoes when looking at a trail that crosses thousands of miles. Other times, the PCT undergoes bigger relocation projects based on a process called Optimal Location Reviews (OLR). These relocations can be significant and can take years to complete. These projects aim to relocate the PCT to a location better suited to providing a natural setting, scenic beauty, and safe public access, among other things. As a result of these projects, the trail’s length may fluctuate by several miles. But they also end up making the trail safer and more enjoyable for all.
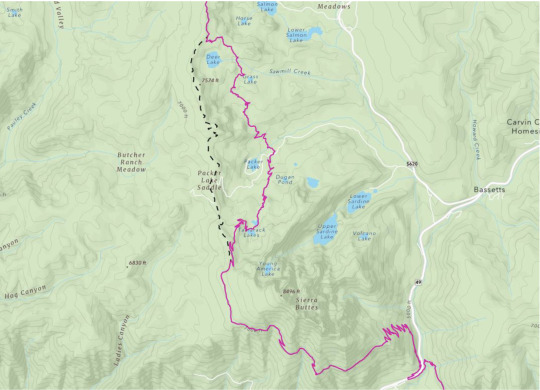
The Sierra Buttes Relocation – Old decommissioned PCT shown in dashed black line, current PCT in maroon.
What’s so hard about miles?
Calculating distance across such a large geographic extent is challenging. Even minor inaccuracies that are repeated hundreds of thousands of times compound errors, resulting in significant discrepancies in overall mileage. For example, if each point in our PCT dataset were off by 1ft, the margin of error would be over 200 miles. Additionally, the translation from a three-dimensional Earth to a two-dimensional map necessitates “projecting” data in GIS (Graphical Informational System) software, which can introduce different types of accuracy loss. However, advancements in technology offer us promising avenues for improvement, such as using LiDAR (laser scans of the earth) to more precisely capture and map changes to the trail.
A little bit about the data
PCTA’s current iteration of PCT mapping data is built upon data that was donated to the organization from the Halfmile Project. You may have heard of Halfmile, he and his team are kind of a big deal. The resulting data from this project’s multi-year effort was the best, most accurate data for the PCT of its time. Volunteers in the project mapped thousands of miles of trail with survey-grade custom and commercial GPS units and spent tremendous amounts of time analyzing, processing, and curating the results.

Halfmile, using his iPhone to control the Long Distance Geo Logger. The blue GPS unit is in the lower black side pocket of his pack. You can see coiled cable right above it.
Building on this legacy, PCTA now builds upon that same highly accurate data from Halfmile, revised to account for re-routes and trail reconstruction that have happened since PCTA assumed control of the data. We maintain our PCT Centerline (the line data for the trail’s location) and Mile Markers (points every tenth or half mile), with new versions released on an annual basis, usually in January. The data is displayed on our Interactive Map and made available on our PCT Data webpage, freely available for download in a variety of formats. By fostering an environment of transparency and accessibility, we empower trail users, app developers, and agency partners alike to utilize this standardized dataset, facilitating seamless communication and navigation along the trail.

Graceland takes an emotional moment at the Northern Terminus after an adventure of a lifetime. Photo by: James Townsend
Conclusions
As we continue to monitor changes, refine our modeling of the PCT, and offer it to users in new ways, we realize that our data remains imperfect. Digitally representing the complexities of the natural world always is. Despite this, the Association’s renewed prioritization of data management, built upon the invaluable foundation set by the Halfmile project, marks significant progress in this work. We recognize that our path toward data accuracy is ongoing and that we’re by no means at the finish line (approx. 2,655.8 ), but we’re always improving, collaborating, and working to celebrate the intricacies of the PCT in this unique aspect of our work.
Author: Galen Keily

4 notes
·
View notes
Text
2 notes
·
View notes
Text
Explaining Complex Models to Business Stakeholders: Understanding LightGBM

As machine learning models like LightGBM become more accurate and efficient, they also tend to grow in complexity, making them harder to interpret for business stakeholders. This challenge arises as these advanced models, often referred to as "black-box" models, provide superior performance but lack transparency in their decision-making processes. This lack of interpretability can hinder model adoption rates, impede the evaluation of feature impacts, complicate hyper-parameter tuning, raise fairness concerns, and make it difficult to identify potential vulnerabilities within the model.
To explain a LightGBM (Light Gradient Boosting Machine) model, it's essential to understand that LightGBM is a gradient boosting ensemble method based on decision trees. It is optimized for high performance with distributed systems and can be used for both classification and regression tasks. LightGBM creates decision trees that grow leaf-wise, meaning that only a single leaf is split based on the gain. This approach can sometimes lead to overfitting, especially with smaller datasets. To prevent overfitting, limiting the tree depth is recommended.
One of the key features of LightGBM is its histogram-based method, where data is bucketed into bins using a histogram of the distribution. Instead of each data point, these bins are used to iterate, calculate the gain, and split the data. This method is efficient for sparse datasets. LightGBM also employs exclusive feature bundling to reduce dimensionality, making the algorithm faster and more efficient.
LightGBM uses Gradient-based One Side Sampling (GOSS) for dataset sampling. GOSS assigns higher weights to data points with larger gradients when calculating the gain, ensuring that instances contributing more to training are prioritized. Data points with smaller gradients are randomly removed, while some are retained to maintain accuracy. This sampling method is generally more effective than random sampling at the same rate.
As machine learning models like LightGBM become more accurate and efficient, they also tend to grow in complexity, making them harder to interpret for business stakeholders. This challenge arises as these advanced models, often referred to as "black-box" models, provide superior performance but lack transparency in their decision-making processes. This lack of interpretability can hinder model adoption rates, impede the evaluation of feature impacts, complicate hyper-parameter tuning, raise fairness concerns, and make it difficult to identify potential vulnerabilities within the model.
Global and Local Explainability:
LightGBM, a tree-based boosting model, is known for its precision in delivering outcomes. However, its complexity can present challenges in understanding the inner workings of the model. To address this issue, it is crucial to focus on two key aspects of model explainability: global and local explainability.
- Global Explainability: Global explainability refers to understanding the overall behavior of the model and how different features contribute to its predictions. Techniques like feature importance analysis can help stakeholders grasp which features are most influential in the model's decision-making process.
- Local Explainability: Local explainability involves understanding how the model arrives at specific predictions for individual data points. Methods like SHAP (SHapley Additive exPlanations) can provide insights into the contribution of each feature to a particular prediction, enhancing the interpretability of the model at a granular level.
Python Code Snippet for Model Explainability:
To demonstrate the explainability of a LightGBM model using Python, we can utilize the SHAP library to generate local explanations for individual predictions. Below is a sample code snippet showcasing how SHAP can be applied to interpret the predictions of a LightGBM model:
```python
# Import necessary libraries
import shap
import lightgbm as lgb
# Load the LightGBM model
model = lgb.Booster(model_file='model.txt') # Load the model from a file
# Load the dataset for which you want to explain predictions
data = ...
# Initialize the SHAP explainer with the LightGBM model
explainer = shap.TreeExplainer(model)
# Generate SHAP values for a specific data point
shap_values = explainer.shap_values(data)
# Visualize the SHAP values
shap.initjs()
shap.force_plot(explainer.expected_value, shap_values[0], data) ,,,
In this code snippet, we first load the LightGBM model and the dataset for which we want to explain predictions. We then initialize a SHAP explainer with the model and generate SHAP values for a specific data point. Finally, we visualize the SHAP values using a force plot to provide a clear understanding of how each feature contributes to the model's prediction for that data point.
Examples of Using LightGBM in Industries
LightGBM, with its high performance and efficiency, finds applications across various industries, providing accurate predictions and valuable insights. Here are some examples of how LightGBM is utilized in different sectors:
1. Finance Industry:
- Credit Scoring: LightGBM is commonly used for credit scoring models in the finance sector. By analyzing historical data and customer behavior, financial institutions can assess creditworthiness and make informed lending decisions.
- Risk Management: LightGBM helps in identifying and mitigating risks by analyzing market trends, customer data, and other relevant factors to predict potential risks and optimize risk management strategies.
2. Healthcare Industry:
- Disease Diagnosis: LightGBM can be employed for disease diagnosis and prognosis prediction based on patient data, medical history, and diagnostic tests. It aids healthcare professionals in making accurate and timely decisions for patient care.
- Drug Discovery: In pharmaceutical research, LightGBM can analyze molecular data, drug interactions, and biological pathways to accelerate drug discovery processes and identify potential candidates for further testing.
3. E-commerce and Retail:
- Recommendation Systems: LightGBM powers recommendation engines in e-commerce platforms by analyzing user behavior, purchase history, and product preferences to provide personalized recommendations, enhancing user experience and increasing sales.
- Inventory Management: By forecasting demand, optimizing pricing strategies, and managing inventory levels efficiently, LightGBM helps e-commerce and retail businesses reduce costs, minimize stockouts, and improve overall operational efficiency.
4. Manufacturing and Supply Chain:
- Predictive Maintenance: LightGBM can predict equipment failures and maintenance needs in manufacturing plants by analyzing sensor data, production metrics, and historical maintenance records, enabling proactive maintenance scheduling and minimizing downtime.
- Supply Chain Optimization: LightGBM assists in optimizing supply chain operations by forecasting demand, identifying bottlenecks, and streamlining logistics processes, leading to cost savings and improved supply chain efficiency.
5. Marketing and Advertising:
- Customer Segmentation: LightGBM enables marketers to segment customers based on behavior, demographics, and preferences, allowing targeted marketing campaigns and personalized messaging to enhance customer engagement and retention.
- Click-Through Rate Prediction: In digital advertising, LightGBM is used to predict click-through rates for ad placements, optimize ad targeting, and maximize advertising ROI by showing relevant ads to the right audience.
These examples illustrate the versatility and effectiveness of LightGBM in addressing diverse challenges and driving value across industries. By leveraging its capabilities for predictive modeling, optimization, and decision-making, organizations can harness the power of LightGBM to gain a competitive edge and achieve business objectives efficiently.
By leveraging tools like SHAP, data scientists can enhance the explainability of complex models like LightGBM, enabling better communication with business stakeholders and fostering trust in the model's decision-making process.
In the era of advanced machine learning models, achieving model explainability is crucial for ensuring transparency, trust, and compliance with regulatory requirements. By employing techniques like SHAP and focusing on global and local explainability, data scientists can bridge the gap between complex models like LightGBM and business stakeholders, facilitating informed decision-making and fostering a deeper understanding of the model's inner workings.
In summary, LightGBM is a powerful machine learning algorithm that leverages gradient boosting and decision trees to achieve high performance and efficiency in both classification and regression tasks. Its unique features like leaf-wise tree growth, histogram-based data processing, exclusive feature bundling, and GOSS sampling contribute to its effectiveness in handling complex datasets and producing accurate predictions.
2 notes
·
View notes
Text

Deep learning streamlines identification of 2D materials
Researchers have developed a deep learning-based approach that significantly streamlines the accurate identification and classification of two-dimensional (2D) materials through Raman spectroscopy. In comparison, traditional Raman analysis methods are slow and require manual subjective interpretation. This new method will speed up the development and analysis of 2D materials, which are used in a variety of applications such as electronics and medical technologies. The research is published in the journal Applied Materials Today. "Sometimes, we only have a few samples of the 2D material we want to study, or limited resources for taking multiple measurements," says Yaping Qi, the lead researcher (Tohoku University), "As a result, the spectral data tends to be limited and unevenly distributed. We looked towards a generative model that would enhance such datasets. It essentially fills in the blanks for us."
Read more.
#Materials Science#Science#2D materials#Computational materials science#Raman spectroscopy#Tohoku University
11 notes
·
View notes
Text


Field-level inference: Unlocking the full potential of galaxy maps to explore new physics
Galaxies are not islands in the cosmos. While globally the universe expands—driven by the mysterious "dark energy"—locally, galaxies cluster through gravitational interactions, forming the cosmic web held together by dark matter's gravity. For cosmologists, galaxies are test particles to study gravity, dark matter and dark energy.
For the first time, MPA researchers and alumni have now used a novel method that fully exploits all information in galaxy maps and applied it to simulated but realistic datasets. Their study demonstrates that this new method will provide a much more stringent test of the cosmological standard model, and has the potential to shed new light on gravity and the dark universe.
From tiny fluctuations in the primordial universe, the vast cosmic web emerged: galaxies and galaxy clusters form at the peaks of (over)dense regions, connected by cosmic filaments with empty voids in between. Today, millions of galaxies sit across the cosmic web. Large galaxy surveys map those galaxies to trace the underlying spatial matter distribution and track their growth or temporal evolution.
Observing and analyzing millions of galaxies turns out to be a daunting task. Hence, standard analyses first compress the three-dimensional galaxy distribution into measurements of the spatial correlation between pairs and triplets of galaxies, technically known as the two- and three-point correlation functions (see TOP IMAGE).
These restricted statistics, however, potentially leave out a lot of information in galaxy maps, especially information encoded on smaller spatial scales. In addition, they do not tell us where in the maps to look further, should some surprising result turn up in these statistics. How much more information can be extracted?
A recent study published in Physical Review Letters by MPA researchers and alumni, led by Dr. Minh Nguyen, provides compelling evidence for significant information beyond the reach of two- and three-point functions.
For the study, the team have developed and validated a rigorous probabilistic framework, LEFTfield, to model the clustering of galaxies. How the LEFTfield framework leverages the Effective Field Theory of Large-Scale Structure (EFTofLSS) to produce robust and accurate predictions of the observed galaxy field with high efficiency was the topic of another MPA research highlight.
LEFTfield foward–models the evolution of primordial fluctuations into large-scale structure and galaxy clustering, preserving the entire information in the three-dimensional distribution of galaxies. Further, the LEFTfield forward model is differentiable, allowing for field-level inference (FLI) of both parameters in the cosmological model and the primordial fluctuations from which all structure in the universe emerged.
In the study, the team set up an apples-to-apples comparison between FLI and the standard two-point plus three-point ("2+3-pt") inference. Both inference pipelines adopt the same LEFTfield forward model, and use the observed maps on strictly the same scales, as illustrated by the centre image.
Analyzing the same catalogs of dark-matter halos from the same set of N-body simulations, the team found that FLI improves constraints on the amplitude of structure growth by a factor of 3–5, even with conservative scale cuts in both analyses.
The improvement implies that even without aggressively pushing down to very small scales—where we expect EFTofLSS or even N-body simulations to fail—much more information can still be extracted from galaxy clustering simply by opening up another dimension: getting rid of the compression of the input data.
The lower image compares the constraints on the amplitude of structure growth from the FLI and "2+3-pt" analyses. The parameter σ8 quantifies the typical amplitude of structure in the initial ("linear") density field on a certain scale.
Essentially, galaxy clustering constraints on σ8 probe the growth of structure from the early universe (where we have precise measurements thanks to the cosmic microwave background) to late times. For this reason, this is a parameter that is generally modified in non-standard cosmological models, for example, if gravity is not correctly described by General Relativity, or if dark matter is not cold.
A factor of 5 improvement in parameter constraints effectively "increases" the survey volume by more than an order of magnitude, which is a huge improvement given the time-consuming and expensive process of mapping out the galaxy distribution over a large volume. Moreover, FLI in principle guarantees optimal extraction of cosmological information: there is no data compression, hence no information loss.
While this study used dark matter halos in simulations, the conclusions also hold for significantly more realistic simulated galaxies, which were the subject of a parallel study by the Beyond-2pt Collaboration that includes two researchers from the MPA team, the FLI approach based on the LEFTfield framework again returns unbiased and improved constraint on growth of structure.
Beyond improved parameter constraints, FLI also offers numerous ways to find out where evidence for physics beyond the standard model of cosmology might come from, should such evidence appear.
Since we have samples of universes that are compatible with the data, we can look for those regions most strongly deviant from the standard model, and investigate what is unusual about them. We can also employ independent datasets, for example, by correlating the inferred matter density with gravitational lensing maps, which are an entirely different probe of structure.
The team now set their eyes on applying the novel FLI approach and LEFTfield framework to real data from galaxy surveys. To connect FLI to observations, a better understanding, hence more studies, of how observational systematics impact the model predictions at the field level will be required. A flexible-yet-efficient forward-modeling framework like LEFTfield will be the key for such studies, and for unlocking the full potential of FLI from galaxy maps.
TOP IMAGE: Summary statistics like the two- and three-point correlation functions compress the galaxy field into spatial correlations between pairs and triplets of galaxies (left panel). Field-level statistics bypass the compression step to access the entire information in the galaxy field. Credit: MPA
CENTRE IMAGE: The comparison between FLI and 2+3-point inference adopts the same forward model, LEFTfield, for both inference schemes. The key difference is FLI analyzes the entire galaxy field while 2+3-point inference analyzes only the 2+3-point summaries of the (same) galaxy field. Credit: MPA
LOWER IMAGE: Constraints on the amplitude of growth of structure σ8 are improved by up to a factor of 5 when analyzing the whole galaxy field compared to just the 2- and 3-point correlation functions. Credit: MPA
3 notes
·
View notes